Infographic explaining difference between 1.5 and 2 degrees of warming

Impacts at 1.5 and 2 degrees of warming

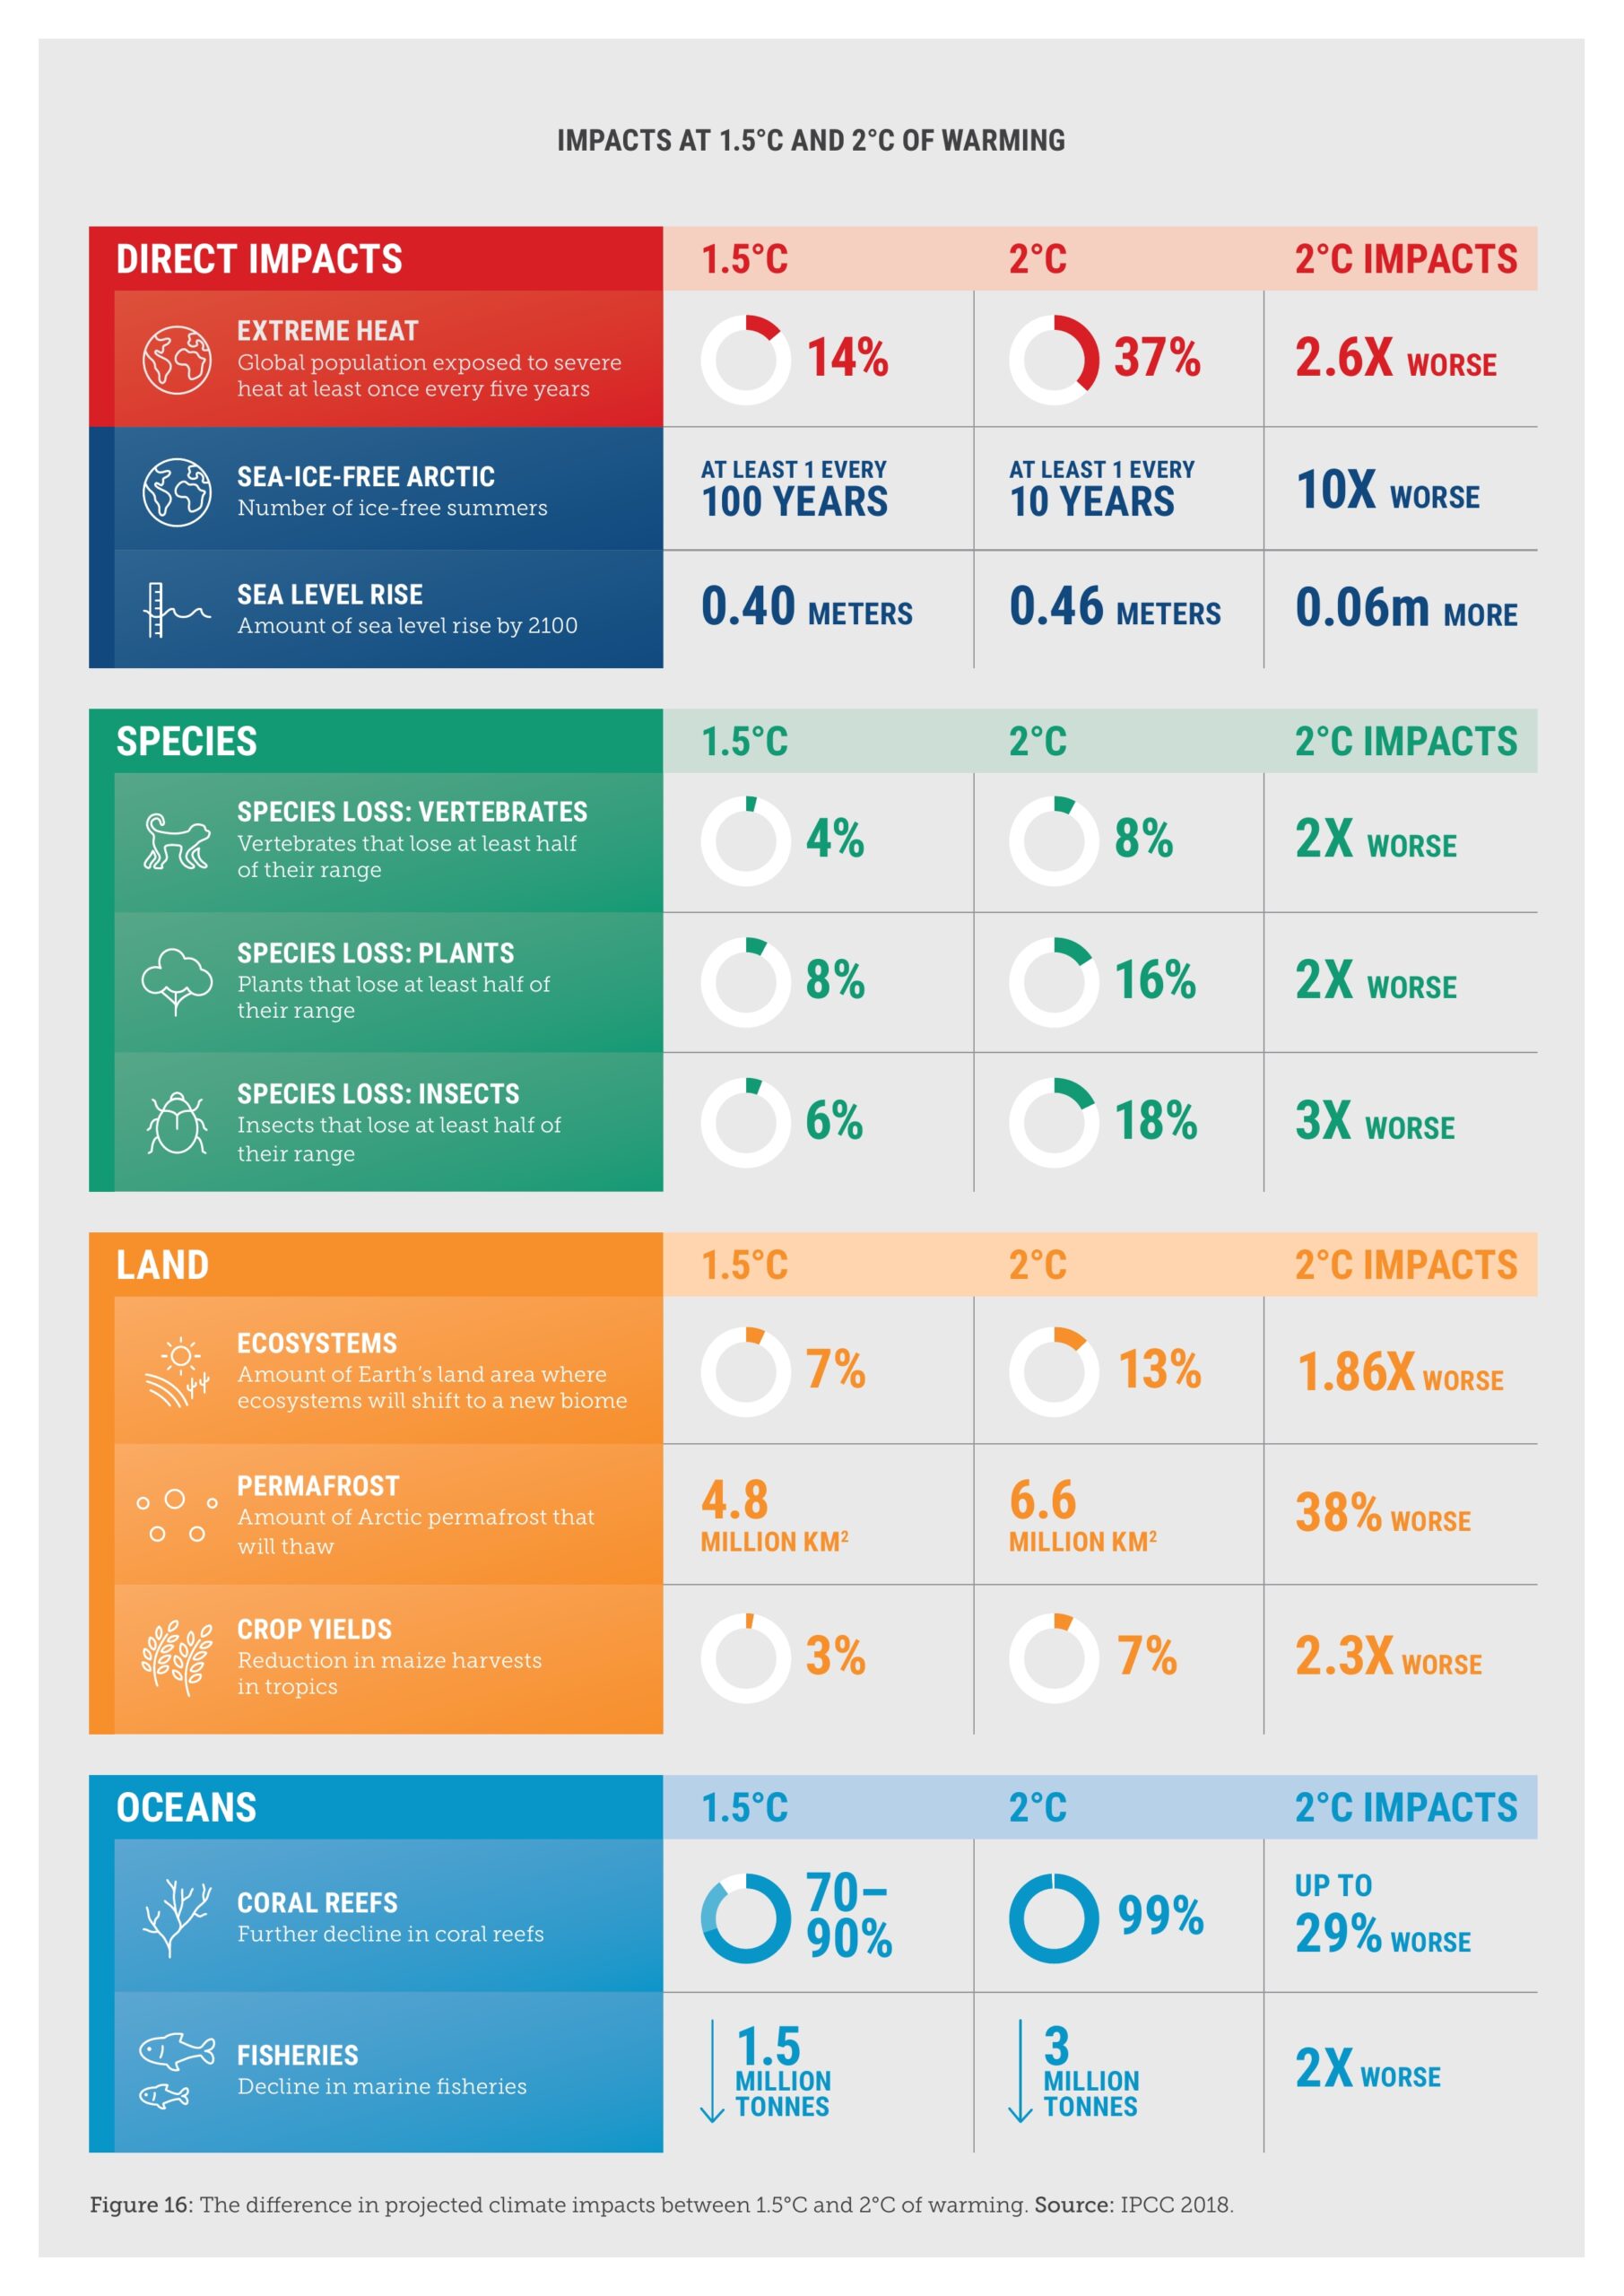
A few degrees of warming is incredibly significant.

The IPCC’s Special Report on Global Warming of 1.5°C, released in 2018, warned that allowing the planet to warm by more than 1.5°C above pre-industrial levels would have grave consequences.

The impacts that we are experiencing now at around a 1.2°C rise in average temperature are forerunners of rapidly escalating risks as global temperatures rise towards 2°C and beyond. Time is rapidly running out for humanity to avoid the extremely serious risks of a 2°C or warmer world. 

Every fraction of a degree of avoided warming matters, and will be measured in lives, species and ecosystems lost or saved. We must do everything possible to deeply and rapidly cut our emissions, while also preparing for climate impacts that can no longer be avoided.

Australia has everything it needs to act swiftly and decisively to help avert climate catastrophe and prosper in a global clean economy.

Catastrophic outcomes for humanity cannot be ruled out if we fail to meet the climate challenge this decade.

For an explainer on the most recent IPCC Synthesis Report, see here. 

Read more in our report, ‘Aim High, Go Fast: Why Emissions Need to Plummet This Decade’.

Infographic explaining difference between 1.5 and 2 degrees of warming

Click here to download the infographic

How much space do renewables really need?

Australia is on its way to becoming a renewable super power, with wind and solar farms generating clean electricity in every state and territory. The amount of land required to build renewable energy is a common misconception. The great news is, we don’t actually need that much space to power ourselves with renewables.

2024 progress scorecard: How states and territories measure up

Nowhere is our rapid shift towards an economy powered by renewable energy more visible than at the state and territory level, where governments, communities and households are leading the charge. This transformation is dynamic, with different states and territories leading the way on different aspects.

What is coral bleaching infographic

Coral reefs are highly vulnerable to climate pollution. Warmer ocean temperatures and other stressors cause coral bleaching events which can damage and destroy coral reefs and the ecosystems the support. Mass coral bleaching is a recent phenomenon. The first global bleaching event occurred in 1998.

How Polluting is Australia vs UAE

Australia continues to fuel the climate crisis through its enormous fossil fuel exports. Australia is the world’s fifth largest overall producer of coal and seventh biggest producer of gas (UNEP 2023a). Most of this is not needed for our own energy needs, and is sold offshore. That’s why Australia is the world’s third largest fossil fuel exporter.

The Climate Crisis is an oceans crisis

The ocean is at the heart of the earth’s climate system. this means climate change – driven by the burning of coal, oil and gas – is rapidly transforming our oceans as well as our climate.

Electric Ute parked in front of wind turbines

Electric utes available now and in the future

Utes have long been part of work life in Australia, used in particular for construction, mining and agriculture. Some drivers also use them for convenience and recreation, with utes now making up one in five new car sales. The good news is zero emissions electric utes are on the way.

Illustration of three fires

Infographic: How does climate change affect bushfires?

The catastrophic bushfire season we are currently experiencing in Australia is a clear example of the impacts of climate change playing out before our eyes. This infographic explains how climate change influences bushfires in four ways.