Why are sea levels rising?
Sea-level rise is driven by climate pollution – primarily from burning coal, oil and gas – which has warmed the Earth’s average surface temperature by around 1.4°C since pre-industrial times (1850-1900).
The oceans have absorbed around 90% of this excess energy causing the average sea surface temperature to rise by about 1°C since pre-industrial times.
Sea levels are rising for two main reasons. As the oceans warm, seawater expands and increases in volume. At the same time, extra heat in the atmosphere and ocean is melting glaciers and ice sheets, which adds more water to the oceans.
The Greenland and Antarctic ice sheets are the largest contributors. Greenland is losing more than 250 billion tons of ice annually, while West Antarctica is also experiencing rapid ice loss. Mountain glaciers around the world are shrinking, with much of this water eventually flowing into the oceans.
How much have sea levels risen already?
Over the past century, the global mean sea level has risen by around 22 cm. Consistent and continuous global satellite records for sea level rise started in 1993, and show sea level rise accelerating since this time. Recent measurements show a rise of around 3.5 cm per decade. Sea-level rise is not uniform with significant regional variations. Around most of Australia, the rate of sea-level rise is close to the global average. But in some areas – such as the north and southeast of Australia – the rate of sea-level rise is significantly faster.
How much will sea levels rise in the future?
This really depends on us. The amount of climate pollution we can avoid makes a real difference to the amount of sea level rise we can expect.
Sea level rise by 2100
If global temperature rise is limited to 1.5°C , we can expect a median sea-level rise of around 44cm by 2100. In contrast, if we follow a high climate pollution path, we will be dealing with a median sea level rise of around 70cm by 2100, and up to two metres under the worst case scenarios. This cannot be ruled out because of deep uncertainties in ice sheet dynamics, or, in other words, the speed at which ice sheets melt.
These and other sea-level rise scenarios for Australia can be explored on Coastal Risk Australia.
Long-term sea level rise
Controlling sea-level rise can be compared to piloting a massive ocean liner: It will take a long time for us to reverse course, even if we were to cease releasing climate pollution immediately. Available projections often go out to 2100, but sea-level rise will continue long after that because of deep ocean warming and ice sheet melt. This is known as the long-term commitment, or ‘locked in’ sea-level rise. Differences in sea-level rise between low, medium and high emissions scenarios (1.5°C and 2°C and 3°C) become increasingly pronounced after 2100.
Sustained global warming of 2–3°C would lead to the near-complete loss of the Greenland and West Antarctic ice sheets, which would condemn our planet to multi-metre sea-level rise over millennia. This is one of the reasons why it is so important to keep temperature rise as close to 1.5°C as possible, with limited overshoot.
The amount of sea-level rise that we can expect under different global warming scenarios is shown below. The long-term sea level commitment, or “locked in” sea level rise, can also be explored on Climate Central – or explored for our major cities in the maps embedded below.
| Global average temperature rise | Most likely* sea-level rise by 2100, and the range (relative to 1995-2014) | Most likely* long-term commitment (over next 2000 years) |
| 1.5C | 44 cm (34-59 cm) | 2.9 m |
| 2C | 51 cm (40-69 cm) | 4.7 m |
| 3C | 61 cm (50-81 cm) | 6.4 m |
| 4C | 70 cm (58-92 cm) | 8.9 m |
Source: 2100 data from NASA. Long term data from: Strauss et al. 2021 and IPCC AR6 WG1 SPM.
*Most likely is used here to refer to ‘median’.
What are the impacts of sea-level rise?
Sea-level rise is like a sleeping giant for Australia and many other countries. It occurs slowly, so it can often go unnoticed. However, this will have enormous consequences for Australians.
Flooding and shoreline recession: Sea-level rise increases the risk of extreme sea level events by elevating the baseline on which tides, surges and waves ride into the coast. Extreme sea level events that are rare today will become much more frequent in the future. Even small increases in sea levels can dramatically increase the risk of flooding, with one in 100-year events becoming annual; or even more frequent.
In 2025, the extreme sea level event caused by Tropical Cyclone Alfred eroded around six million cubic metres of sand from beaches of the Gold Coast and the Sunshine Coast in Queensland leaving sand cliffs that measured up to six metres in height. An extensive dredging operation was needed to restore sand on the beaches.
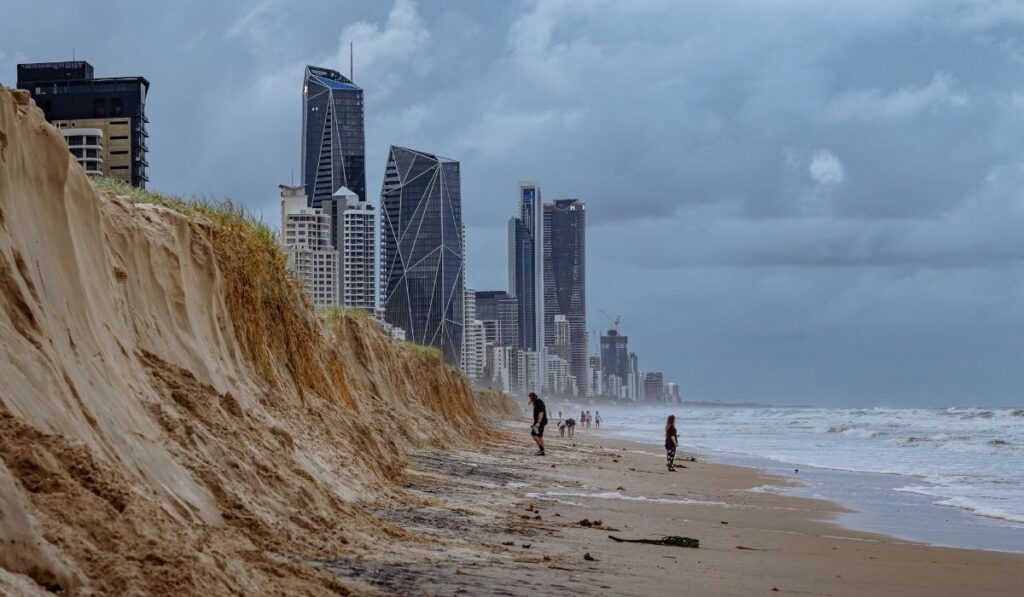
As a rule of thumb, each centimetre rise in sea level results in around one metre horizontal loss of sandy shorelines. This is known as the Bruun rule. In reality, the amount of sand lost depends on multiple factors including the slope of the beach and other local factors. Very steep beaches can lose less than this, while flatter areas can be more dramatically eroded. Either way, sea level rise is going to alter our beaches and coastal ecosystems, and put coastal housing and infrastructure at risk.
Port Fairy is a prime example. Located 280km west of Melbourne on Victoria’s south west coast, Port Fairy’s south coastline is low-lying and subject to wave run-up and inundation. Seawater regularly spills onto the road and adjoining land during storm surges. Thirty houses are at risk of being undermined by present day erosion, a number that will increase to around 200 by 2100. The east-facing beach consists of fine sand, making it highly susceptible to erosion and dune recession. Under existing sea-level rise, two decommissioned landfills have become exposed due to dune recession and are releasing contaminants and debris into the coastal environment.
Coastal communities and infrastructure: The National Climate Risk Assessment (2025) found that 597,000 people live in areas that will directly be exposed to risks from sea-level rise by 2030, rising to 1.5 million people by 2050 and 3 million by 2090. The number of coastal communities at high or very high risk of coastal impacts from sea-level rise will increase from 8% to 18% by 2050, with increased coastal flooding compromising community infrastructure and drinking water supplies. Queensland is particularly exposed to sea-level rise, with 18 of the top 20 most-exposed regions located there.
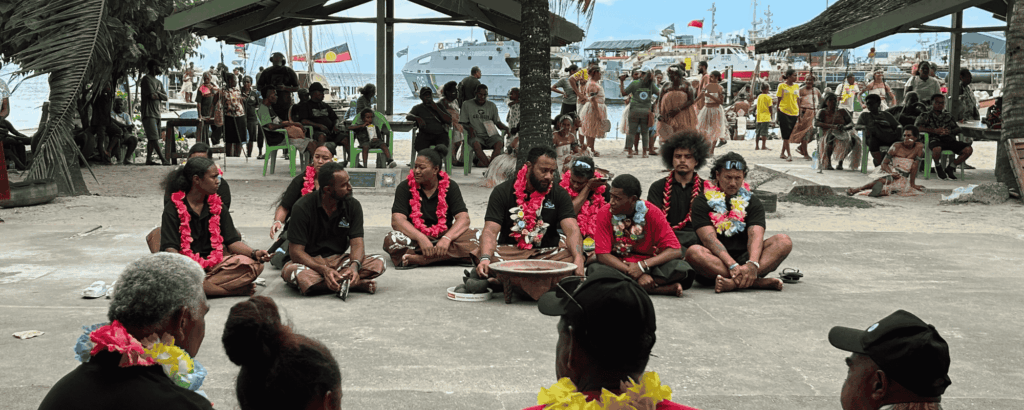
One of the most exposed regions in Australia is the Torres Strait. Climate change poses an existential threat to the unique cultures, livelihoods, island communities and ecosystems of this region. Sea-level rise in the Torres Strait is much higher than the global average (around 6-8mm/year) and some of the islands are very low-lying (e.g. Boigu, Saibai, Poruma, Masig and Warraber). Already, king tides cause widespread inundation; flooding homes and graveyards, destroying gardens, contaminating soil, and threatening infrastructure. In the long-term, it is feared that the low-lying areas of the Torres Strait will be lost to sea-level rise, which represents an enormous threat to the culture and identity of Torres Strait Islanders.
What can we do about it?
We will need to adapt to the sea-level rise that is now unavoidable. In some cases this will mean retreat (where possible) or creating soft coastal defences such as mangrove plantations or building hard coastal defences such as seawalls (which are costly to build and maintain, and have complex impacts on shorelines downstream).
While preparing and adapting to the consequences of sea-level rise, we should be doing everything we can to avoid even worse by cutting climate pollution deeper and faster. How bad things get from here really depends on us, and every tonne of climate pollution we avoid really matters.
Climate Central’s Coastal Risk Screening Tool
In the maps below, the amount of long term sea level rise that can be expected at different global warming levels is shown. Currently, if all countries meet their 2030 climate pledges (NDCs), we are on track for a world with warming of roughly 2.3–2.5°C. Current policies—meaning what governments are actually doing right now, not just promising—suggest a warming of around 2.8°C or higher by 2100. The maps below are compare long-term sea level rise at warming of 1.5°C and 2.8° (what governments are doing, not just promising).