In our fourth state and territory renewable energy update, the Climate Council compared the performance of Australian states and territories across a range of renewable energy metrics, unveiling the leaders and laggards of Australia’s action on climate change.
The findings confirm, as in the past, that in the absence of federal policy, the states and territories have continued to lead Australia’s electricity transition from fossil fuels to a modern, flexible and clean electricity system powered by renewable energy and storage.
Why does Australia need to transition to renewable energy?
The impact of rising and historic pollution levels are already being felt globally.
Over the last few years, the world has experienced the hottest five-year period (2013-2017) ever recorded. This record is part of a sharp, long-term upswing in global temperatures, with 17 of the 18 hottest years on record all occurring in this century (NOAA 2018). The resulting warming has compounded weather events across the world, breaking records set in “a world which no longer exists” according to Martin Hoerling, a research meteorologist at the National Oceanic and Atmospheric Administration.
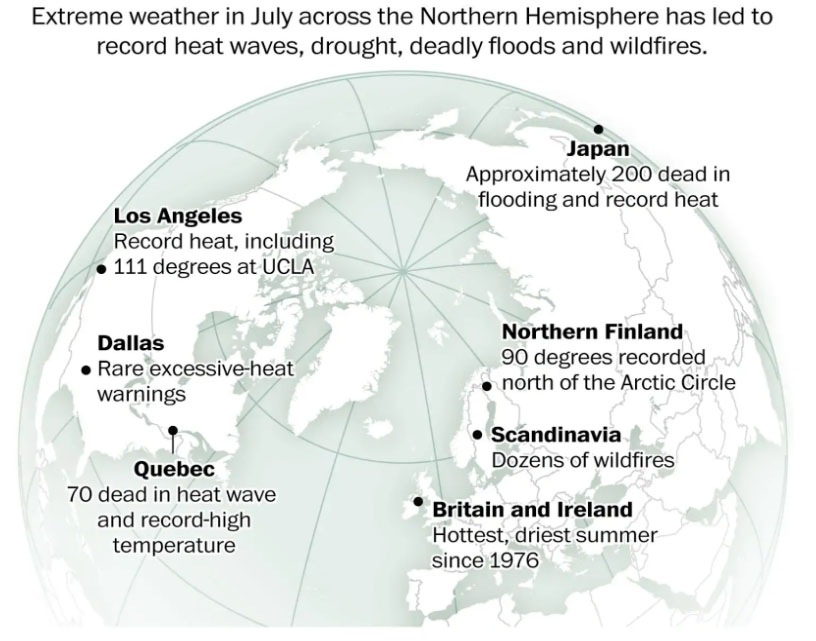
Source: Lauren Tierney, Washington Post
Among the developed world, Australia will be among the most vulnerable and hardest hit by the impacts of climate change (Gergis, 2018). An introduction to this ‘new world’ can currently be seen in Australia’s worsening drought and extended bushfire season.
Yet, Australia remains without credible federal policy to reduce its greenhouse gas pollution levels in line with the Paris Agreement, nor has it provided any pathways for reaching net-zero emissions well before 2050.
In this absence of leadership from the federal government, state governments have been stepping into the breach with policies to encourage the uptake of renewable energy and storage.
States and territories 2018 renewable energy scorecard
The Climate Council’s 2018 renewable energy scorecard finds the Australian Capital Territory (ACT), South Australia and Tasmania are leading the other states and territories across a range of renewable energy measures – percentage renewable energy, wind and solar capacity per capita, proportion of households with solar, and renewable energy targets and policies.
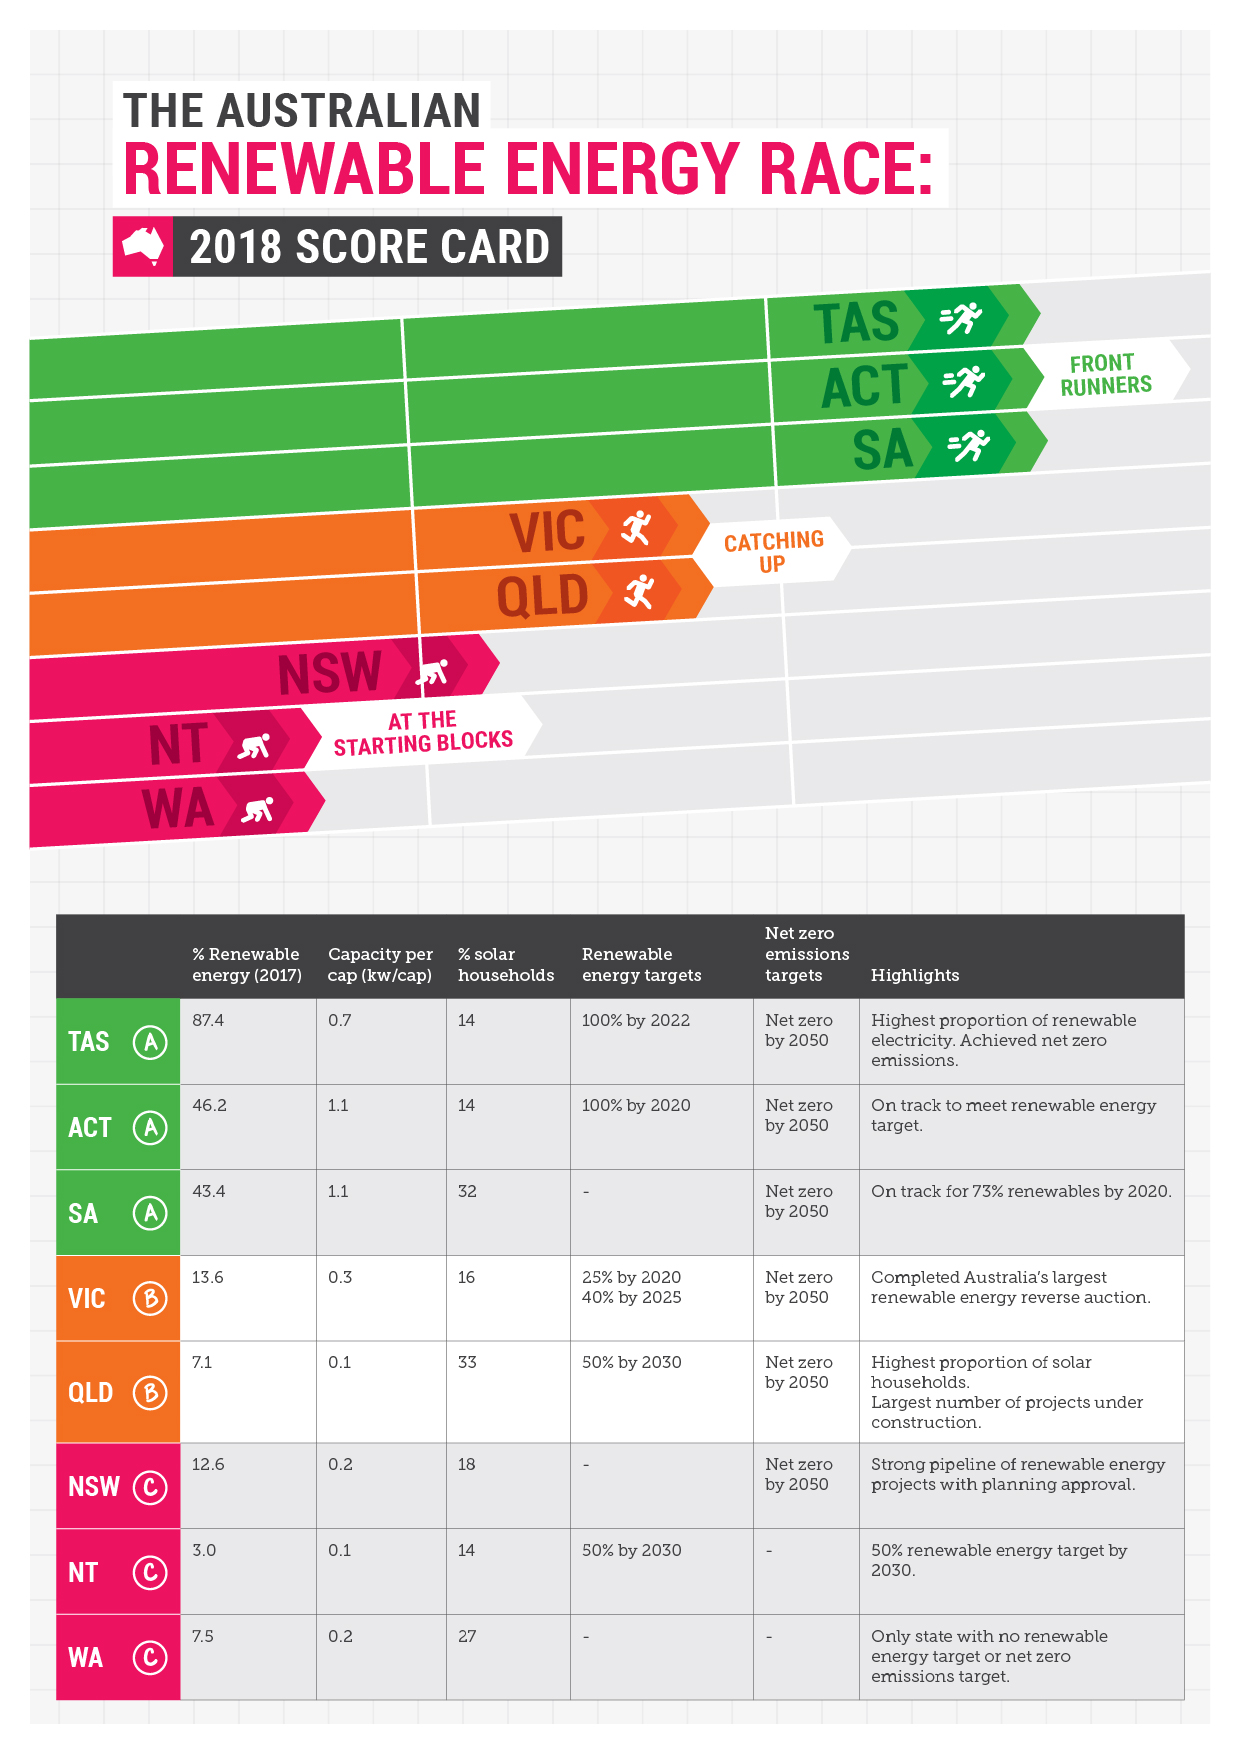
Scorecard highlights:
- Tasmania, the ACT and South Australia have the highest proportion of renewable electricity
- South Australia continues to have the largest amount of installed wind and solar capacity (1,831MW), closely followed by New South Wales (1,759MW) and Victoria (1,634MW). On a per capita basis, South Australia, the ACT and Tasmania lead in capacity per person.
- Queensland and South Australia have the highest proportion of households with rooftop solar, at 32.9% and 32.3% respectively. Western Australia is in third place with 26.7% of households with rooftop solar.
- With the exception of Western Australia, all states and territories have committed to a renewable energy target and/or net zero emissions targets.
Western Australia and the Northern Territory are lagging behind the other states and territories. Western Australia’s share of renewable energy is low, however the state has the third highest proportion of households with rooftop solar. The Northern Territory has a low share of renewable electricity and solar households, but is set to implement its plan to reach 50% by 2030.
Who’s leading the states renewable energy race?
Among the states and territories, the ACT, Tasmania and South Australia are leading the way on a range of renewable energy measures. For more details, and to find out where the other states and territories sit, see our report Powering Progress: States Renewable Energy Race.
ACT
In 2017, the ACT consumed around half (46.2%) of its electricity from renewable energy sources, the second highest amount of any state or territory in Australia after Tasmania (Department of the Environment and Energy 2018).
The ACT is well on track to hit its target of 100% renewable energy in 2020, after contracting enough wind and solar projects to meet this target.
To supplement this increased renewable generation, the ACT is also embracing energy storage, with an ambitious plan to roll out 5,000 battery storage systems across ACT households and businesses by 2020 (ActSmart 2018).
The territory has upped the ante again, moving its net zero emissions target ahead five years to 2045.
SOUTH AUSTRALIA
In 2017, South Australia saw a slight slip in renewable energy generation to 43.4%, a reduction of 3.6%. The reduction was brought on by higher gas generation, and higher electricity demand (Department of the Environment and Energy 2018).
South Australia continues to have a high proportion of households with rooftop solar (second only to Queensland) and high levels of large-scale renewable energy per capita. In 2018, the incoming state government dropped the state’s renewable energy target and net zero emissions target, which has seen South Australia’s position on the scorecard fall from first (in 2017) to third (in 2018).
In early December 2017 the world’s largest operating battery, the Tesla-Neoen 100MW battery began operating in South Australia, providing the grid with faster, more efficient responses to energy shortages. The battery was so effective that during one instance on the 14th of January, the battery is estimated to have reduced costs to consumers by $3.5 million over a five-hour period (AEMO 2018a).
In 2017 the South Australian government also unveiled its ‘virtual power plant’ plan, investing heavily in household batteries, with one hundred 13.5kWh batteries already rolled out at low income Housing SA homes (RenewEconomy 2018). Another 1,000 homes will soon follow, with the potential to scale up the program to 50,000 Housing SA and low income homes (RenewEconomy 2018). These batteries will store solar energy and will help to reduce consumers power bills.
TASMANIA
In 2017 Tasmania generated 87.4% of its electricity from renewable sources. Falling from (91.8%) in the year prior. The slight dip was mostly the result of lower hydro generation and higher gas generation (Department of the Environment and Energy 2018).
The state is working towards a 100% renewable energy target for 2022. To achieve this goal, the government is supporting the construction of two new wind farms totalling 256MW (ABC News 2017).
Tasmania is also considering the feasibility of its ‘battery of the nation’ scheme, which would see a potential 4,800 MW of pumped hydro energy storage to support the National Energy Market. However, to do so would require an additional interstate connector between Tasmania and Victoria, at a cost of $1 billion.
Tasmania has also become the first state to achieve net zero emissions in 2015-16. A consequence of the states extensive forestry, which offsets emissions from other sectors, as well as its vast hydro power resources, small energy demand and population.
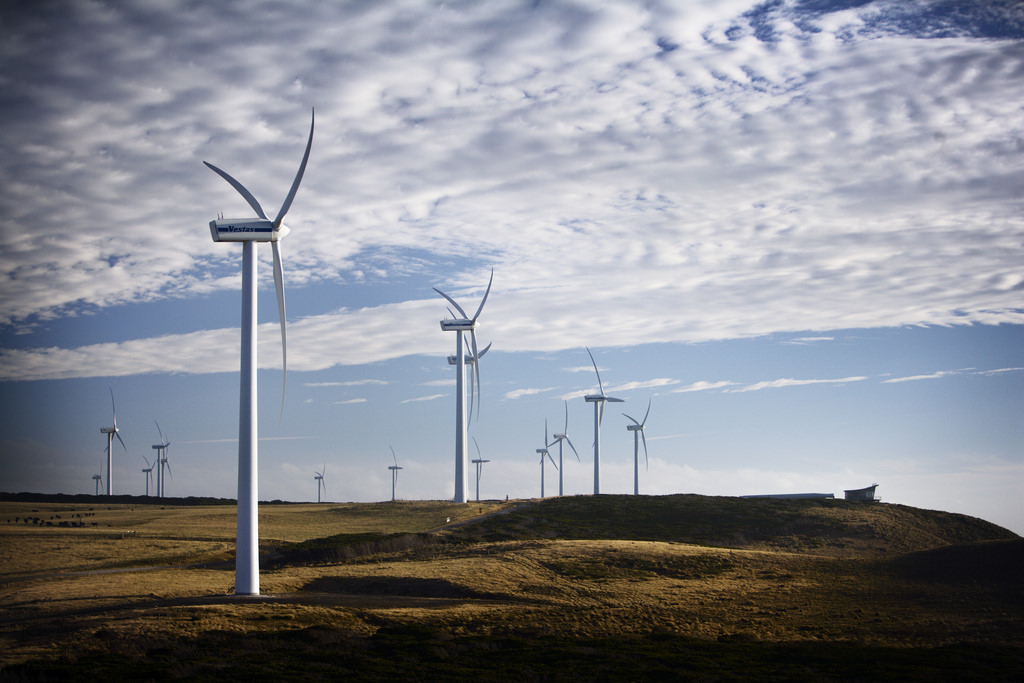 Woolnorth, Tasmania by Flickr user The Danish Wind Industry Association licensed under CC BY-NC 2.0
REFERENCES
ABC News (2017) Tasmania’s eye on full renewable energy by 2022, but work still to be done on securing supply. 16 August 2017. Accessed at: http://www.abc.net.au/news/2017-08-16/recommendations-from-tas-energy-security-taskforce/8814220
ActSmart (2018) Household Battery Storage. Accessed at: https://www.actsmart.act.gov.au/what-can-i-do/homes/discounted-battery-storage
AEMO (Australian Energy Market Operator) (2017) South Australian Generation Forecasts. 15 December 2017. Accessed at: http://www.aemo.com.au/-/media/Files/Electricity/NEM/Planning_and_Forecasting/SA_Advisory/2017/2017-South-Australian-Generation-Forecast.pdf
AEMO (2018a) Quarterly Energy Dynamics: Q1 2018. Accessed at: http://www.aemo.com.au/-/media/Files/Media_Centre/2018/QED-Q1-2018.pdf
Australian Government (2018) Quarterly Update of Australia’s National Greenhouse Gas Inventory: December 2017. 18 May 2018. Accessed at: http://www.environment.gov.au/system/files/resources/7b9824b8-49cc-4c96-b5d6-f03911e9a01d/files/nggi-quarterly-update-dec-2017-revised.pdf
Department of the Environment and Energy (2018) Australian Energy Statistics, Table O, Australian electricity generation, by fuel type, physical units. April 2018. Accessed at: https://www.energy.gov.au/sites/g/files/net3411/f/aes-table-o-2016-17_2017.pdf
Gergis, J 2018, Sunburnt country : the history and future of climate change in Australia, Carlton, Victoria : Melbourne University Publishing, 2018.
New MG, Liverman DM, Betts RA, Anderson KL, West CC (2011) Four degrees and beyond: the potential for a global temperature increase of four degrees and its implications. The Royal Society Publishing, 369:1934.
NOAA (National Oceanic and Atmospheric Administration) (2018) Global Analysis – Global Climate Report – Annual 2017. Accessed at: https://www.ncdc.noaa.gov/sotc/
RenewEconomy (2018) Tesla builds case for 250MW virtual power plant after first trial success. 15 July 2018. Accessed at: https://reneweconomy.com.au/tesla-builds-case-for-250mw-virtual-power-plant-after-first-trial-success-63950/